Performance Load Testing
Will your app survive a traffic spike from a successful ad campaign or a viral post? Don't hope—know.
Simulate thousands of users to find your limits and guarantee a flawless user experience.
Don't Let Success Crash Your Site
A slow website doesn't just frustrate users—it costs you money. Every second of downtime damages your reputation and your bottom line. With proactive load testing, you can find and fix performance bottlenecks before your customers ever feel them.
Prevent Costly Downtime
Discover your app's breaking point in our test environment, not in the middle of a Black Friday sale.
Optimize User Experience
Slow load times kill conversions. Ensure your site is snappy and responsive under any load to keep users happy and engaged.
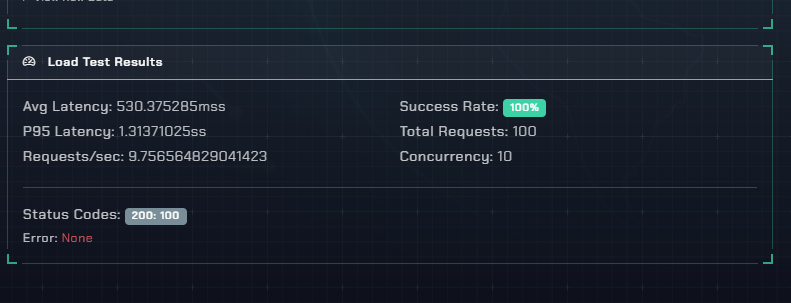
Actionable Metrics, Not Just Numbers
We give you the clear, crucial data you need to improve your application's performance.
Response Time Metrics
See exactly how long users are waiting. We track average, peak, and 95th percentile times so you can spot slowdowns as load increases.
Requests Per Second (RPS)
Understand your application's true capacity. Measure exactly how many requests your server can handle before performance degrades.
Error Rate Analysis
Pinpoint the exact moment your app starts to buckle. Track server errors as the load increases to find your system's stress points.
Virtual User Simulation
Recreate your busiest day on demand. Easily configure tests to simulate hundreds or thousands of concurrent users hitting your site.
Bottleneck Identification
Find the needle in the haystack. By seeing which requests slow down first, you can hunt down the slow code, database queries, or APIs causing the jam.
Visual Performance Graphs
See the whole story at a glance. Our charts make it easy to see the relationship between user load, response times, and errors.
Ready to Test Your Limits?
Launch your next campaign with confidence. Find your performance problems before your customers do.
Run your first load test in minutes.